Substance Use Epidemiology Section
Publications
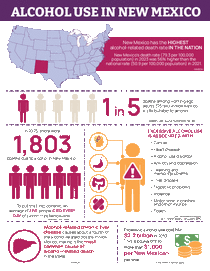 Alcohol Use in New Mexico Infographic (October 2025)
Substance Use Epidemiology - Marketing
October 23, 2025
This helpful infographic provides information on the use of alcohol in New Mexico in a visual fashion which makes it easy to understand. Highlights include death rates among working age adults, daily deaths due to alcohol-related issues, what is considered excessive drinking, and more.
 Substance Use & Mental Health Epidemiology Profile Dashboard - Executive Summary (September 2025)
Substance Use Epidemiology - General
September 25, 2025
The Substance Use & Mental Health Epidemiology Profile (SUMHEP) Dashboard is a unique dashboard that contains trends on both substance use and mental health. The executive summary is a companion to the dashboard and provides a brief overview of different trends for the many different indicators on the dashboard.
 Substance Use & Mental Health Epidemiology Profile Dashboard - Introduction (September 2025)
Substance Use Epidemiology - General
September 25, 2025
The New Mexico Substance Use & Mental Health Epidemiology Profile (SUMHEP) Dashboard is a tool for substance use planners at the state, county, and community level and is replacing the Substance Use Epidemiology Profile (SUEP) Reports. The Substance Use Epidemiology Section, within the New Mexico Department of Health (NMDOH), will refresh the data on a quarterly basis and the last refresh date will appear in the top right of the first page of the dashboard.
 DOSE Digest – Published by the CDC OD2A Team (March 2025)
Substance Use Epidemiology - Marketing
April 11, 2025
DOSE Digest – Published by the CDC OD2A Team (March 2025)
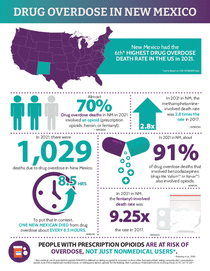 Drug Overdose in New Mexico Infographic (September 2023)
Substance Use Epidemiology - Marketing
December 12, 2023
This helpful infographic provides information on drug overdoses in New Mexico in a visual fashion which makes it easy to understand. Highlights include how New Mexico compares with other states, what the actual death rate per year is compared to the national average, how many of these deaths involve prescription opioids or heroin, increase in prescription opioids sold in New Mexico, common places prescription opioids are maintained for nonmedical use, and more.
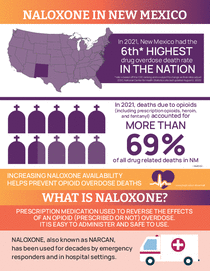 Naloxone in New Mexico Infographic (September 2023)
Substance Use Epidemiology - Marketing
December 12, 2023
This helpful infographic provides information on naloxone in New Mexico in a visual fashion which makes it easy to understand. Highlights include a description of what naloxone is, how much it has helped reduced opioid overdose deaths, how many people are enrolled in naloxone distribution programs, how many naloxone kits were dispensed, and more.
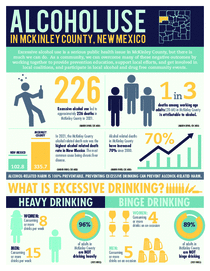 Alcohol Use in McKinley County (June 2023)
Substance Use Epidemiology - Marketing
June 20, 2023
This helpful infographic provides information on the use of alcohol in McKinley County New Mexico in a visual fashion which makes it easy to understand. Highlights include death rates among working age adults, daily deaths due to alcohol-related issues, what is considered excessive drinking, and more.
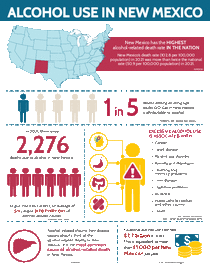 Alcohol Use in New Mexico
Substance Use Epidemiology - Marketing
June 20, 2023
This helpful infographic provides information on the use of alcohol in New Mexico in a visual fashion which makes it easy to understand. Highlights include death rates among working age adults, daily deaths due to alcohol-related issues, what is considered excessive drinking, and more.
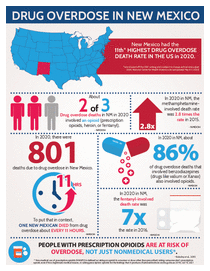 Drug Overdose in New Mexico Infographic (May 2022)
Substance Use Epidemiology - Marketing
June 8, 2022
This helpful infographic provides information on drug overdoses in New Mexico in a visual fashion which makes it easy to understand. Highlights include how New Mexico compares with other states, what the actual death rate per year is compared to the national average, how many of these deaths involve prescription opioids or heroin, increase in prescription opioids sold in New Mexico, common places prescription opioids are maintained for nonmedical use, and more.
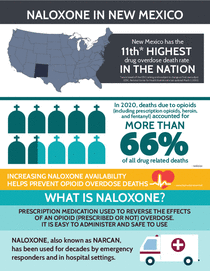 Naloxone in New Mexico Infographic (May 2022)
Substance Use Epidemiology - Marketing
May 31, 2022
This helpful infographic provides information on naloxone in New Mexico in a visual fashion which makes it easy to understand. Highlights include a description of what naloxone is, how much it has helped reduced opioid overdose deaths, how many people are enrolled in naloxone distribution programs, how many naloxone kits were dispensed, and more.
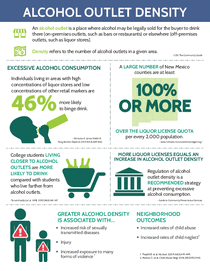 Alcohol Outlet Density in New Mexico Infographic (February 2016)
Substance Use Epidemiology - Marketing
May 20, 2021
This helpful infographic provides information on the alcohol outlet density in New Mexico in a visual fashion which makes it easy to understand. Highlights include the effects of greater alcohol density, neighborhood outcomes, mental health effects, motor vehicle accidents, intimate partner violence, underage drinking, and more.
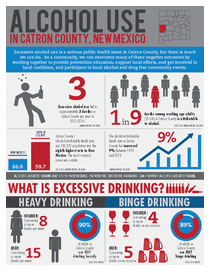 Alcohol Use in Catron County Infographic
Substance Use Epidemiology - Marketing
May 20, 2021
Alcohol Use in Catron County Infographic
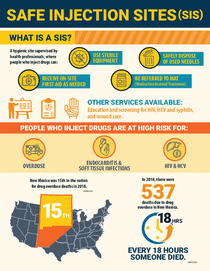 SIS Facetsheet
Substance Use Epidemiology - Marketing
March 26, 2020
This helpful infographic provides information on prescription monitoring programs in the United States in a visual fashion which makes it easy to understand. Highlights include overdose deaths where prescription drugs were involved, how often providers don’t check the prescription monitoring program before prescribing controlled substances, states which are mandating checks, and more.
 New Mexico Substance Use Disorder Treatment Gap Analysis (January 2020)
Substance Use Epidemiology - Marketing
January 24, 2020
The information provided in this document addresses one of the leading causes of early death for New Mexicans the misuse of substances including alcohol and drugs.
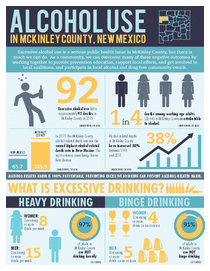 Alcohol Use in McKinley County Infographic
Substance Use Epidemiology - Marketing
March 23, 2017
This helpful infographic provides information on the use of alcohol in McKinley County New Mexico in a visual fashion which makes it easy to understand. Highlights include death rates among working age adults, daily deaths due to alcohol-related issues, what is considered excessive drinking, and more.
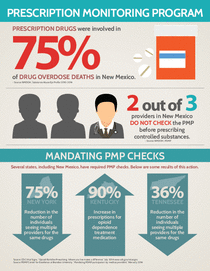 Prescription Monitoring Infographic (March 2016)
Substance Use Epidemiology - Marketing
March 22, 2016
This helpful infographic provides information on prescription monitoring programs in the United States in a visual fashion which makes it easy to understand. Highlights include overdose deaths where prescription drugs were involved, how often providers don’t check the prescription monitoring program before prescribing controlled substances, states which are mandating checks, and more.

